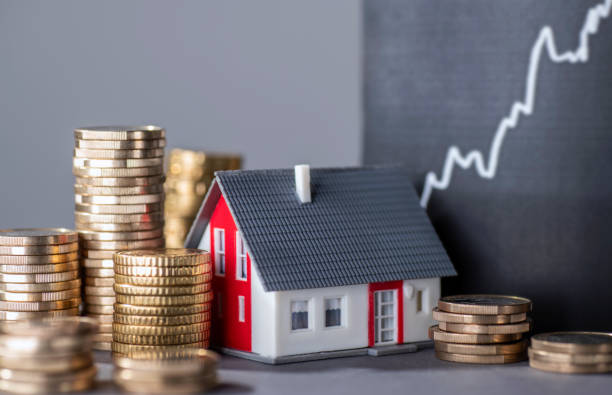
When it comes to real estate, intuition might get your foot in the door—but metrics open the gates to success. At Tower Bridge, we emphasize data-driven decisions to empower property investors with the insights they need to grow confidently and profitably.
🧠 Why the Numbers Matter
Understanding your property’s performance isn't just about collecting rent. It's about reading the story that the numbers tell—one that can guide your strategy, reveal opportunities, and shield you from unnecessary risks.
These key performance indicators (KPIs) form the backbone of smart investing:
💸 Cash Flow
📐 Cap Rate
📈 Appreciation
📅 Days on Market (DOM)
💰 Cash-on-Cash Return
🏠 Vacancy Rate
Let’s break them down and explore how they work together to shape smart real estate decisions.
💸 Cash Flow: The Lifeblood of Profitability
Cash flow is the money left over after covering operating expenses, loan payments, and any other financial obligations tied to your property. It tells you whether your investment is truly paying off—or draining your wallet.
✅ Positive Cash Flow
When rental income exceeds expenses:
Your property supports itself financially.
You have extra income for upgrades or portfolio expansion.
You’re prepared for vacancies or unexpected repairs.
❌ Negative Cash Flow
When expenses exceed income:
You may need to dip into personal funds temporarily.
The property might be underperforming—or have long-term growth potential.
Strategic investors weigh short-term losses against long-term equity.
📐 Cap Rate: Quick Snapshot of ROI
The cap rate helps you compare investment properties across locations and markets.
Formula:
Cap Rate = Net Operating Income ÷ Market Value
High cap rate: Greater return, higher risk.
Low cap rate: Stability, possibly less aggressive returns.
Cap rates vary by region, property type, and market cycles—use this metric as part of a broader profitability assessment.
📈 Appreciation: Building Wealth Over Time
Appreciation refers to the natural increase in your property’s value, which builds equity without additional investment.
For example, buying at $250,000 and selling for $300,000 years later nets $50,000 in appreciation—even without upgrades.
How to Predict It:
Monitor local job growth, infrastructure, and demand.
Use historical pricing trends and demographic shifts.
Consult experts who understand your market’s long-term potential.
Appreciation rewards those who play the long game and let time do the heavy lifting.
📅 DOM (Days on Market): Demand in Real Time
DOM shows how long properties stay listed before being leased or sold—a direct reflection of market activity.
Low DOM = Hot market, rapid turnover.
High DOM = Market sluggishness or overpricing.
Strategic Use:
Track DOM trends to time purchases, negotiate better deals, and understand local buyer behavior.
💰 Cash-on-Cash Return: ROI That Reflects Reality
Cash-on-Cash Return goes a step further by measuring your actual return on the cash invested, providing an annual ROI snapshot.
Formula:
Cash-on-Cash Return = Annual Pre-Tax Cash Flow ÷ Total Cash Invested
For example:
Invest $60,000
Receive $6,000 in annual cash flow
Your return is 10%
This metric helps evaluate loan terms, compare deal performance, and determine if your cash is working hard enough.
🏠 Vacancy Rate: Health Check for Occupancy
Vacancy Rate tracks what percentage of your units are unoccupied during a set period.
Formula:
Vacancy Rate = (Vacant Units ÷ Total Units) × 100
Low Vacancy = Strong demand, good management.
High Vacancy = Potential issues like overpricing, poor upkeep, or market oversaturation.
Keeping vacancy rates low boosts income, increases stability, and indicates operational success.
🔍 Putting It All Together
Your real estate strategy becomes far stronger when you understand how these metrics interact:
📊 KPI | 🚀 What It Tells You | 🎯 How to Use It Strategically |
Cash Flow | Monthly profit after expenses | Gauge profitability & portfolio strength |
Cap Rate | ROI based on market value | Compare investments & assess risk |
Appreciation | Value growth over time | Build long-term wealth |
Days on Market (DOM) | Market demand and listing speed | Time purchases & spot pricing trends |
Cash-on-Cash Return | Actual ROI on invested capital | Analyze deal performance & financing terms |
Vacancy Rate | % of units unrented | Monitor demand, pricing, & property health |
🏁 Bottom Line: Make Every Number Work for You
Successful investing isn’t about guessing—it’s about knowing. Whether you’re buying your first rental or scaling up a large portfolio, tracking these KPIs puts you in a position to:
Spot opportunities early
Reduce financial risk
Maximize returns with confidence
At Tower Bridge, we help you interpret these metrics so your investments aren’t just smart—they’re strategic.
📞 Ready to grow your portfolio with precision? Contact our team today and let’s crunch the numbers together.


